Creating a Process Data Chart
To create a chart representing process data:
- From the Winshuttle Workflow Central Administration Web site, click Charts in the Reporting section to open the Charts page.
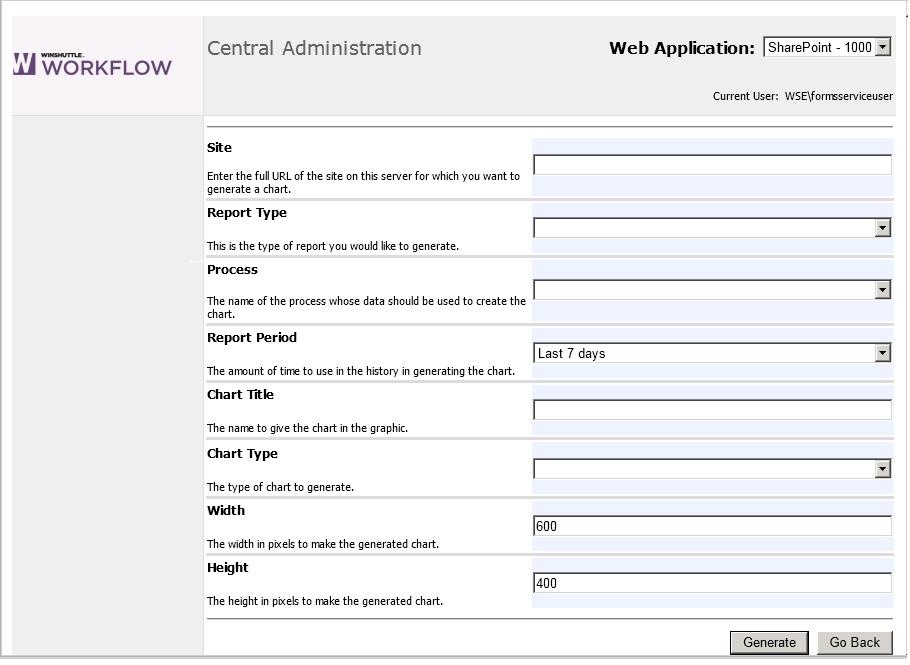
- In the Site box, type the full URL of the Workflow site for which you want to chart process data.
- Press Enter.
- In the Report Type list, select the type of report you want to generate.
- Site Performance Analysis — includes data for all processes for the specified site. If you select this option, skip step 5 and continue to step 6.
- Process Performance Analysis — includes only data for a specific process. Continue to step 5 to select a process.
- Tasks Performance by Process Analysis — includes data for all tasks within a specified process. Continue to step 5 to select a process.
- Performers Performance by Process Analysis — includes data for all workflow participants within a specified process. Continue to step 5 to select a process.
- Select a process from the Process list, which will include all processes on the site you specified in step 2.
- In the Report Period list, select the period of time for which you want to include process data.
- In the Chart Title box, type a name for your chart.
Note: We recommend that you use names that contain only alphanumeric characters and underscores. Avoid using spaces and non-alphanumeric characters.
- In the Chart Type list, select the type of chart you want to create.
- In the Width and Height text boxes, specify the size for the chart in pixels.
- Click Generate. Your process data chart appears at the bottom of the web page.
|

|

|