Error management and trace files
When you run a script, Winshuttle Studio provides information about the run. You can customize how those errors appear.
Studio error options
To set or change the following options, click File > Options > Logs & Errors.
Error display
In the Studio Options box, you can specify whether errors begin with a prefix or are highlighted with a color.
Error prefixes (Transaction only): Click this option to begin each error message with the text that you enter in the Errors and Corrected errors boxes.
Error highlighting (Transaction only): Click this option to highlight each error with the color you choose in the Errors and Corrected errors boxes.
You can also customize what information is displayed in the error message. The choices include:
- Script file name
- Date and time of the run
- Recording mode
- Start and end rows
- Number of errors
- The SAP system and the name of the person who ran the script
Error threshold and trace files
To stop the run after a specified number of errors are found, check the Stop the run after [n] errors box, and then enter the number of errors. Transaction will stop the run when it finds that many errors.
The trace tools generate files that the Support team can use to help to find the root cause of problems you might experience with Studio. In the Studio Options box, you can select which trace to turn on. After you run the script, turn the trace off.
Important: You will see a warning message that the trace file will include your data. If you do not want to send your data to Winshuttle Customer Support, use test data while the trace tools are turned on.
The trace files are stored in the Log folder. The default location is C:\Users\<user name>\Documents\Winshuttle\Studio\Log.
Note: You can set the Log folder location on the Locations tab of the Studio Options box.
View extended log information
The Extended Log option is on the Expert View tab in the Mapper. Just check the box in the Enable column.

Select this check box to see all the messages returned by SAP during the run of a transaction. These include warning messages and informational messages. Uncheck this box to see only the last message returned by SAP.
Note: The Extended Log feature is not available for scripts that were recorded in Batch Input mode or GUI Scripting mode.
Find errors
If a row returns an error and you are not sure where the problem is, the Extended Log column might provide more specific information. In addition, you have two built-in troubleshooting options:
- Run and Stop on Errors: To stop the run on the SAP screen where the error happened. This option brings the SAP screen into the foreground whenever an error occurs during the run.
- Debug: To open the SAP console and step through the script screen by screen while uploading data from the data file to SAP. For more options, click the arrow under the Debug button and choose Debug Specified Range or Debug First Row Only.
Customize error messages
You can customize the messages that appear in the Log column.
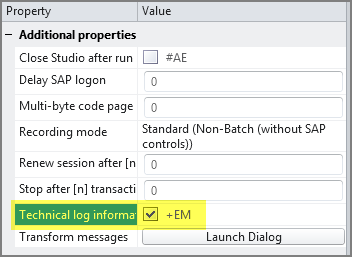
- In the Properties panel on the Map tab, check the Technical log information box.
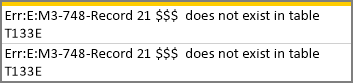
- Run the script, and make a note of the Message ID and Message Number that are returned.
For example, if the code returned is E:M3-748, M3 is the Message ID and 748 is the Message Number.
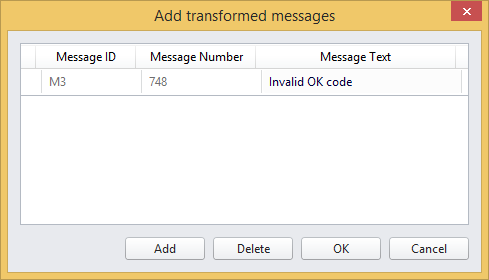
- In the Properties panel on the Map tab, click Launch Dialog.

- Click Add, and then enter the Message ID, Message Number, and the error message text that you want runners to see.
- When you run the script, the custom error message is displayed in the Log column.
