Applies to:
- Winshuttle Foundation
Configuring Winshuttle Workflow logging
Back to
Logs & Reporting topics
Use the Logging page to:
- Enable logging for Winshuttle Workflow 10.8.
- Set logging options, such as frequency and the type of messages logged.
Note: Changes made from this page will be applied to the current Web application and any Web applications sharing the same Workflow database with it.
Enable logging
- Open Workflow Administration site.
- Click Logging.

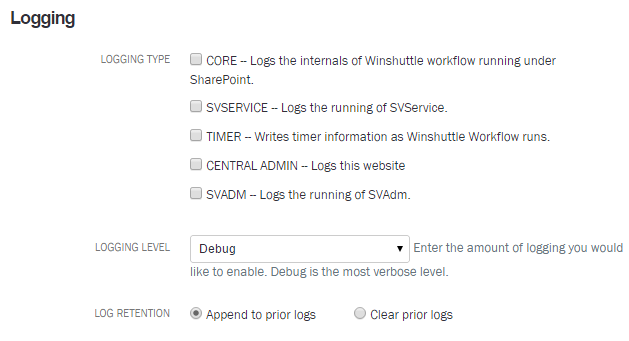
- Select the Logging Type:
- Core — the default type, which logs the internal workings of Winshuttle workflow under SharePoint.
- Timer — logs timer marks within the core product, which can be useful if there are performance problems.
- SVService — logs SVService.
- Central Admin — Logs the Winshuttle Workflow Central website.
- SVAdm — Logs the running of SVAdm.
- Select the Logging Level:
- Error — typically logged whenever a major exception is thrown. This level of logging affects performance the least.
- Warn — this level is used whenever something is detected that is wrong, but is not necessarily fatal. If the system encounters some condition that was not expected, but that was not serious enough to throw an exception, a description will be written to the log at a logging level of Warn. Errors are also included in this level.
- Info — general tracing messages throughout the code. No string composition is done at this level, so no variable data is written at this level. Errors and Warnings are also included in this level.
- Debug — the most detailed logging level. Includes variable data, so string composition is done extensively, which can trigger more frequent garbage collections, etc. Errors, Warnings, and Informational messages are also included in this level. This level of logging has the greatest impact on performance.
- Next to Log Retention, select either Append to Prior Logs or Clear Prior Logs.
- (Optional) Click More Options and you can also specify the following:
- Include Stack Trace for Each Logging Statement: Provides more logging information but will slow down the system considerably. Use this option sparingly.
- Asynchronous Logging: Creates a separate thread for execution to improve system performance when logging is turned on, but writing to the log may cause slight lag.
- Include Only Specific Classes: Enter a comma-separated list of classes to restrict logging.
Advanced logging: Using SVTrace
Back to topSVTrace can be used to provide additional error logging information for Winshuttle Workflow sites. It must be activated by adding an entry to the web.config file for the web app on which Workflow site is present, and it must be activated for all Web front-end servers.
Note: The SVSTack file will only have the latest error related trace. The older error trace will be replaced with the latest one every time an error occurs.
Enabling SVTrace
- Locate the web.config file. It is usually located at C:\inetpub\wwwroot\wss\VirtualDirectories\1000, where 1000 is = the port on which the web app is installed
- Open the Web.config file with any text editor.
- In the Web.Config file, locate AppSettings Update, and then locate the SVTraceLevel key (shown below):
<add key="SVTraceLevel" value="2" />
<add key="SVTracePath" value="C:\Program Files\Common Files\Microsoft Shared\Web Server Extensions\14\WorkflowRoot\temp" />
Note: The SVSTack file will be generated at the path Defined By SVTracePath.
The path C:\Program Files\Common Files\Microsoft Shared\Web Server Extensions\14\WorkflowRoot\temp is a a temporary path used by Workflow for SharePoint 2010. Sp2010.
For SharePoint 2013, the path is C:\Program Files\Common Files\Microsoft Shared\Web Server Extensions\15\WorkflowRoot\temp. - You can set the SVTraceLevel" value= to 1 of 3 levels:
- SVTraceLevel = 0: No trace.
- SVTraceLevel = 1: Fast trace. Shows only the error-relevant stack trace.
- SVTraceLevel = 2: Debug trace. Shows the full stack trace for the error.
- Repeat these steps on each Web front end.